Shaunak Vairagare
GIS Web Developer
shaunakv1@gmail.com
github.com/shaunakv1
832-603-9023
Charleston, SC
Innovative software engineer offering eight plus years of experience in Web development and GIS involving full software development lifecycle – from concept through delivery of next-generation applications and customizable solutions.
Expert in advanced development methodologies, tools and processes. Strong OOP and Design Patterns skills. Deep understanding of OOAD, Agile methods and TDD.
Creative problem solver and experience in designing software work-flows for complex Geo-spatial applications on web, desktop and mobile platforms.
§Technical Skills
- Front End HTML5, CSS3, JavaScript, Angular, D3
- Front End Tools Yeoman, Grunt, Bower
- Web Development Ruby on Rails, Node.js, Spring
- Dev Ops Capistrano, Puppet, AWS Stack, Heroku
- Databases MongoDB, MySQL, PostgreSQL, SQL Server
- Servers Apache2, Phusion Passenger, Tomcat
- Mobile iOS, RubyMotion
- Languages Ruby, JavaScript, Python, Java, ObjectiveC
- Process Tools JIRA, Jenkins, Bamboo
- GIS Servers GeoServer, ArcGIS Server
- Map API OpenLayers, Leaflet, TileMill, Google Maps, BingMaps
- ESRI ArcGIS, ArcGIS Server Rest, Image Services
- OGC WMS, WFS, GeoJSON, GML, KML, GeoRSS. TopoJSON, WMTS
- GIS Tools ArcGIS, FME, GDAL, LibLAS, Java Topology Suite
- GIS Data LiDAR, GeoTIFF, LAS, ShapeFile, GDF
- Carto Databases PostgreSQL/PostGIS , SQL Server Spatial
§ Work Experience (8+ years)
NOAA'S Office For Coastal Management
Sr. GIS Developer
Jun 2012 to Current
University Of Houston
GIS Developer
Aug 2009 to Jun 2012
LocationGuru
Software Developer
Aug 2007 to Jul 2009
GlobalLogic
Student Intern
Sep 2006 to Apr 2007
§ Education
| Master of Science in Computer Science | University of Houston, TX | Aug 2009 to Dec 2011 |
| Bachelor of Engineering in Computer Science | RCOEM, Nagpur, India. | Aug 2003 to May 2007 |
§ Projects
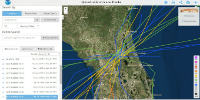
Hurricanes
Hurricanes is an interactive mapping application that easily searches and displays global tropical cyclone data. Users are able to query storms by the storm name, ZIP Code, city, state, geographic region, pressures, intensities and time range.
Key Features: Angular, Leaflet, HTML5, CSS3,Less, HighCharts, Grunt, JSON, ArcGIS Rest, Grunt
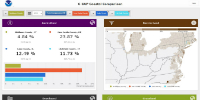
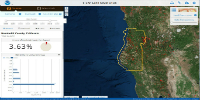
County Comparison
County Comparison is responsive info-graphics tool that compares land cover between different coastal geographies using Land-cover change information developed through NOAA’s Coastal Change Analysis Program (C-CAP). The tool lets users compare counties over different indicators like Developed, wetlands, forests, etc.
Key Features: Responsive, D3 Maps, HTML5, CSS3,Less, Angular, HighCharts, Grunt, jUnit, JSON
Citizen Reporter
Developed this project for Esri Dev Summit Hackathon 2014 Our team won the “3rd Prize”. Citizen-Reporter is crowd-sourced incident reporting app. One simple click reports incidents to our operations dashboard telling it that an event has been witnessed. When more users identify a similar event near you, the incident is automatically voted up simply by proximity. Features a mashup of services like Geofeedia, Twilio, and SendGrid
Key Features: Ruby On Rails, AngularJS, HTML5, CSS3, PostgreSQL, ESRI ArcGIS JavaScript API
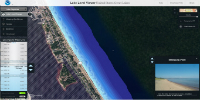
Lake Level Viewer
Lake Level Viewer is a new generation version of the Sea Level Rise Viewer below; accept it shows potential lake level changes for Great Lakes. It also shows 13 levels on map, for both rise and drop in the lake levels. Cached tiles are loaded from ArcGIS Server and rendered on leaflet map to show smooth water level change on map.
Key Features: Interactive Web Map, Leaflet, HTML5, CSS3, Less, JavaScript, jQuery, HighCharts, Grunt, jUnit, ArcGIS Rest, Tile Cache, GeoJSON, Double Buffering Tile Cache to avoid flicker
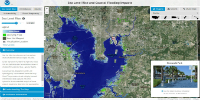
Sea Level Rise Viewer
Sea Level Rise Viewer displays potential future sea levels for coastal USA. A slider lets users quickly simulate water levels directly on map. This viewer also shows sea level rise on actual pictures of local landmarks which correlates with the sea level shown on map. Also provides features like models for marsh migration and socio-economic overlay. It simultaneously displays seven tile cache layers from ArcGIS Server on leaflet map. It uses multiple-buffering on client side to display smooth transitions of sea level changes.
Key Features: Interactive Web Map, Leaflet, HTML5, CSS3, JavaScript, jQuery, HighCharts, Grunt, jUnit, ArcGIS Rest, Tile Cache, GeoJSON, Double Buffering Tile Cache to avoid flicker
C-CAP Land Cover Atlas
Land Cover Atlas is an online map viewer that provides user-friendly access to regional land cover and land cover change information developed through NOAA’s Coastal Change Analysis Program (C-CAP). The tool summarizes general change trends (such as forest losses or new development) and can highlight specific changes of interest. It uses huge datasets exposed using a combination of ArcGIS Server, JSON Web Services and WMS server to display statistics and change rasters on interactive OpenLayers map quickly and efficiently on a very user-friendly interface.
Key Features: Interactive Web Map, OpenLayers, HTML5, CSS3, JavaScript, jQuery, HighCharts, Grunt, jUnit, Web Services, ArcGIS Rest, WMS, Tile Cache, JSON
Satellite Imagery to Assess Rural Electrification
Developed this project as a part of NASA International Space Apps Challenge 2012. This was a 24 hour Hackthon, in which over 2000 people participated worldwide.
Our team won the "Global Impact Award" for the Satellite Imagery to Assess Rural Electrification challenge.
Solution was World at Night which is a web based mapping tool that shows who on planet earth has access to light. It allows users to overlay Night Time Satellite Imagery data with world population and other data to which areas still don't have access to electricity. We also provided tools to calculate which kind of source of electricity (solar, hydro, wind, or traditional) is likely to be most feasible to electrify that region.
Key Features: Interactive Web Map, OpenLayers, Geoserver, Geo-TIFF, ArcGIS, Ruby on Rails, GIS Analysis
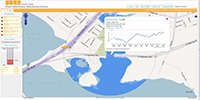
Flood Information Distribution System
A Ruby on Rails based GIS system for flood warning and alert system in Harris County using existing sensor networks of various agencies like Houston Transtar, HCFCD , USGS, City of Houston Public Works. This project is going to be used by EMS agencies like 911, 311, and will also be available to public.
Key Features: Java, OpenLayers, Ruby, Rails, GeoServer, MSSQL Server 2008 Spatial, Map Interface Web Site and Mobile client for Emergency dispatch vehicles, flood data broadcast using VHF (Public Broadcasting, Houston) in case of emergency, ArcGIS for LIDR data, Bing maps, creating Shape-files for sensor networks, flood emergency level calculations using Historical Flood Data and LiDAR. Real time flood water rendering on map.
GeoLocator
A sponsored course project. Developed an iPhone application backed with a GIS database and Ruby on Rails web service to find and service wells.
Key Features: iOS Application, AppStore, Ruby on Rails, Agile, Geolocation, Spatial Search, Web-Services
Arduino Farming Aid Sensor Networks
A project for Cyber Physical Systems Course.Wireless Sensor Networks using Arduino to aid Farming. Has a web front-end developed in Ruby on Rails to control the sensors and display statistics etc.
Key Features: Arduino, Embeded Development, Ruby on Rails, Sensor Networks
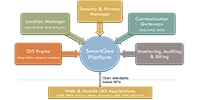
SmartGeo
Java-based Software Development, Product Planning and Engineering, Research and LBS Platform Development
Key Features: Java Web Development, LBS Platform, Image Processing, Real Time Navigation Algorithms, Geospatial Information System, Map Tiling and Rendering Algorithms, Geocoding, Reverse-Geocoding, POI, GIS Hosting, GPS positioning systems, LBS Product concept Planning and Design
Location Diary
A mobile based Location Based Services (LBS) application. Designed and implemented this application in J2ME mobile platform for turn-by-turn navigation instructions.
Key Features: J2ME, Path-Planning Algorithms, Mobile Maps, GPS , Graph Optimizations
Path Finding Algorithms for Natural Terrain Explorers
Designed and implemented simulation of various navigation algorithms for autonomous robotic explorers.
Key Features: Shortest Path and Efficient Navigation algorithms for Space Exploration, Graphical Simulation in Java, and in VC++ using DirectX Graphics technology.
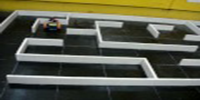
Micro-Mouse
A Self-Guided, Maze-Solving Robot. Made maze solving robot. Also implemented simulator for Navigation Algorithms for the autonomous robot.
Key Features: Autonomous Robotics, Embedded Systems programming, Graphical Simulation in Java, Decision-Making Algorithms.